
——————————————————————————————-
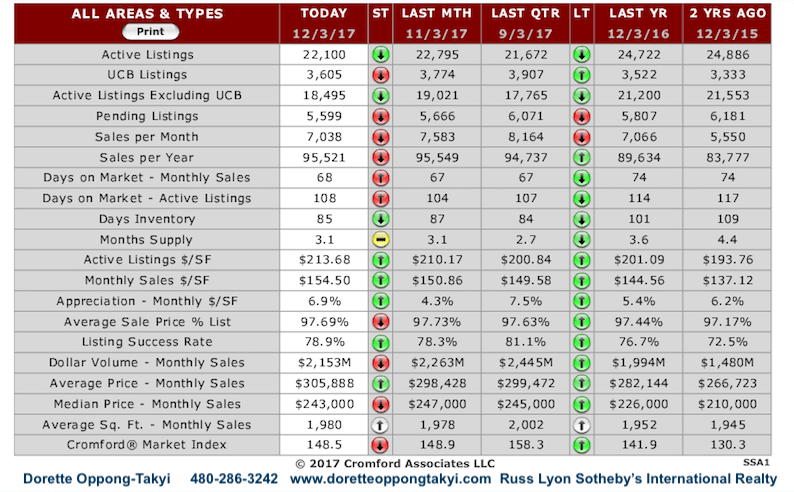
Active Listings (excluding UCB): 18,422 versus 20,928 last year – down 12.0% – and down 1.2% from 18,646 last month
Active Listings (including UCB): 22,019 versus 24,514 last year – down 10.2% – and down 1.7% compared with 22,403 last month
Pending Listings: 5,579 versus 5,782 last year – down 3.5% – and down 1.2% from 5,646 last month
Under Contract Listings (including Pending, CCBS & UCB): 9,176 versus 9,368 last year – down 2.0% – and down 2.4% from 9,403 last month
Monthly Sales: 7,180 versus 6,875 last year – up 4.4% – but down 3.2% from 7,421 last month
Monthly Average Sales Price per Sq. Ft.: $154.62 versus $144.60 last year – up 6.9% – and up 2.7% from $150.53 last month
Monthly Median Sales Price: $244,900 versus $225,000 last year – up 8.8% – but down 0.04% from $245,000 last month
The supply of active listings is still substantially lower than last year, although almost all the drop is for homes under $200,000. We usually get a decent increase during the fall but in 2017 this increase was pretty paltry. Buyers got very little relief except at the upper end of the market, where relief was not required.
There were 19 working days in November 2017, the same as in 2016, so the 4.4% increase in sales is a valid and fair comparison. This is an improvement on October, although the percentage increase in sales is less than the percentage increase in the number of real estate agents since last year (6.3%). Luckily the increase in average prices makes up for that difference and then some.
The average price per square foot jumped a hefty 2.7% in just one month, between October 1 and November 1, putting appreciation back above the rate we saw last year. However those who watch only the median sales price will be disappointed at the lack of movement over the same period.
All in all, November was a positive month for sellers and has turned around the weakening demand trend that prevailed for the prior 3 months. This bodes well for a strong finish to the year in December.
Supply is still high above $1.5 million but demand continues to look better at this end of the market so well-priced homes should not have to wait excessively long to find a buyer.
Sourced from The Cromford Report